Notes
-
DCDS Summer Workshop Series
Check out the Dominguez Center for Data Science summer workshop series! We are partnering with the Emerging Scholars/Undergraduate Research Program, Library Services, and IT to provide different workshops to help you build data skills for your…
-
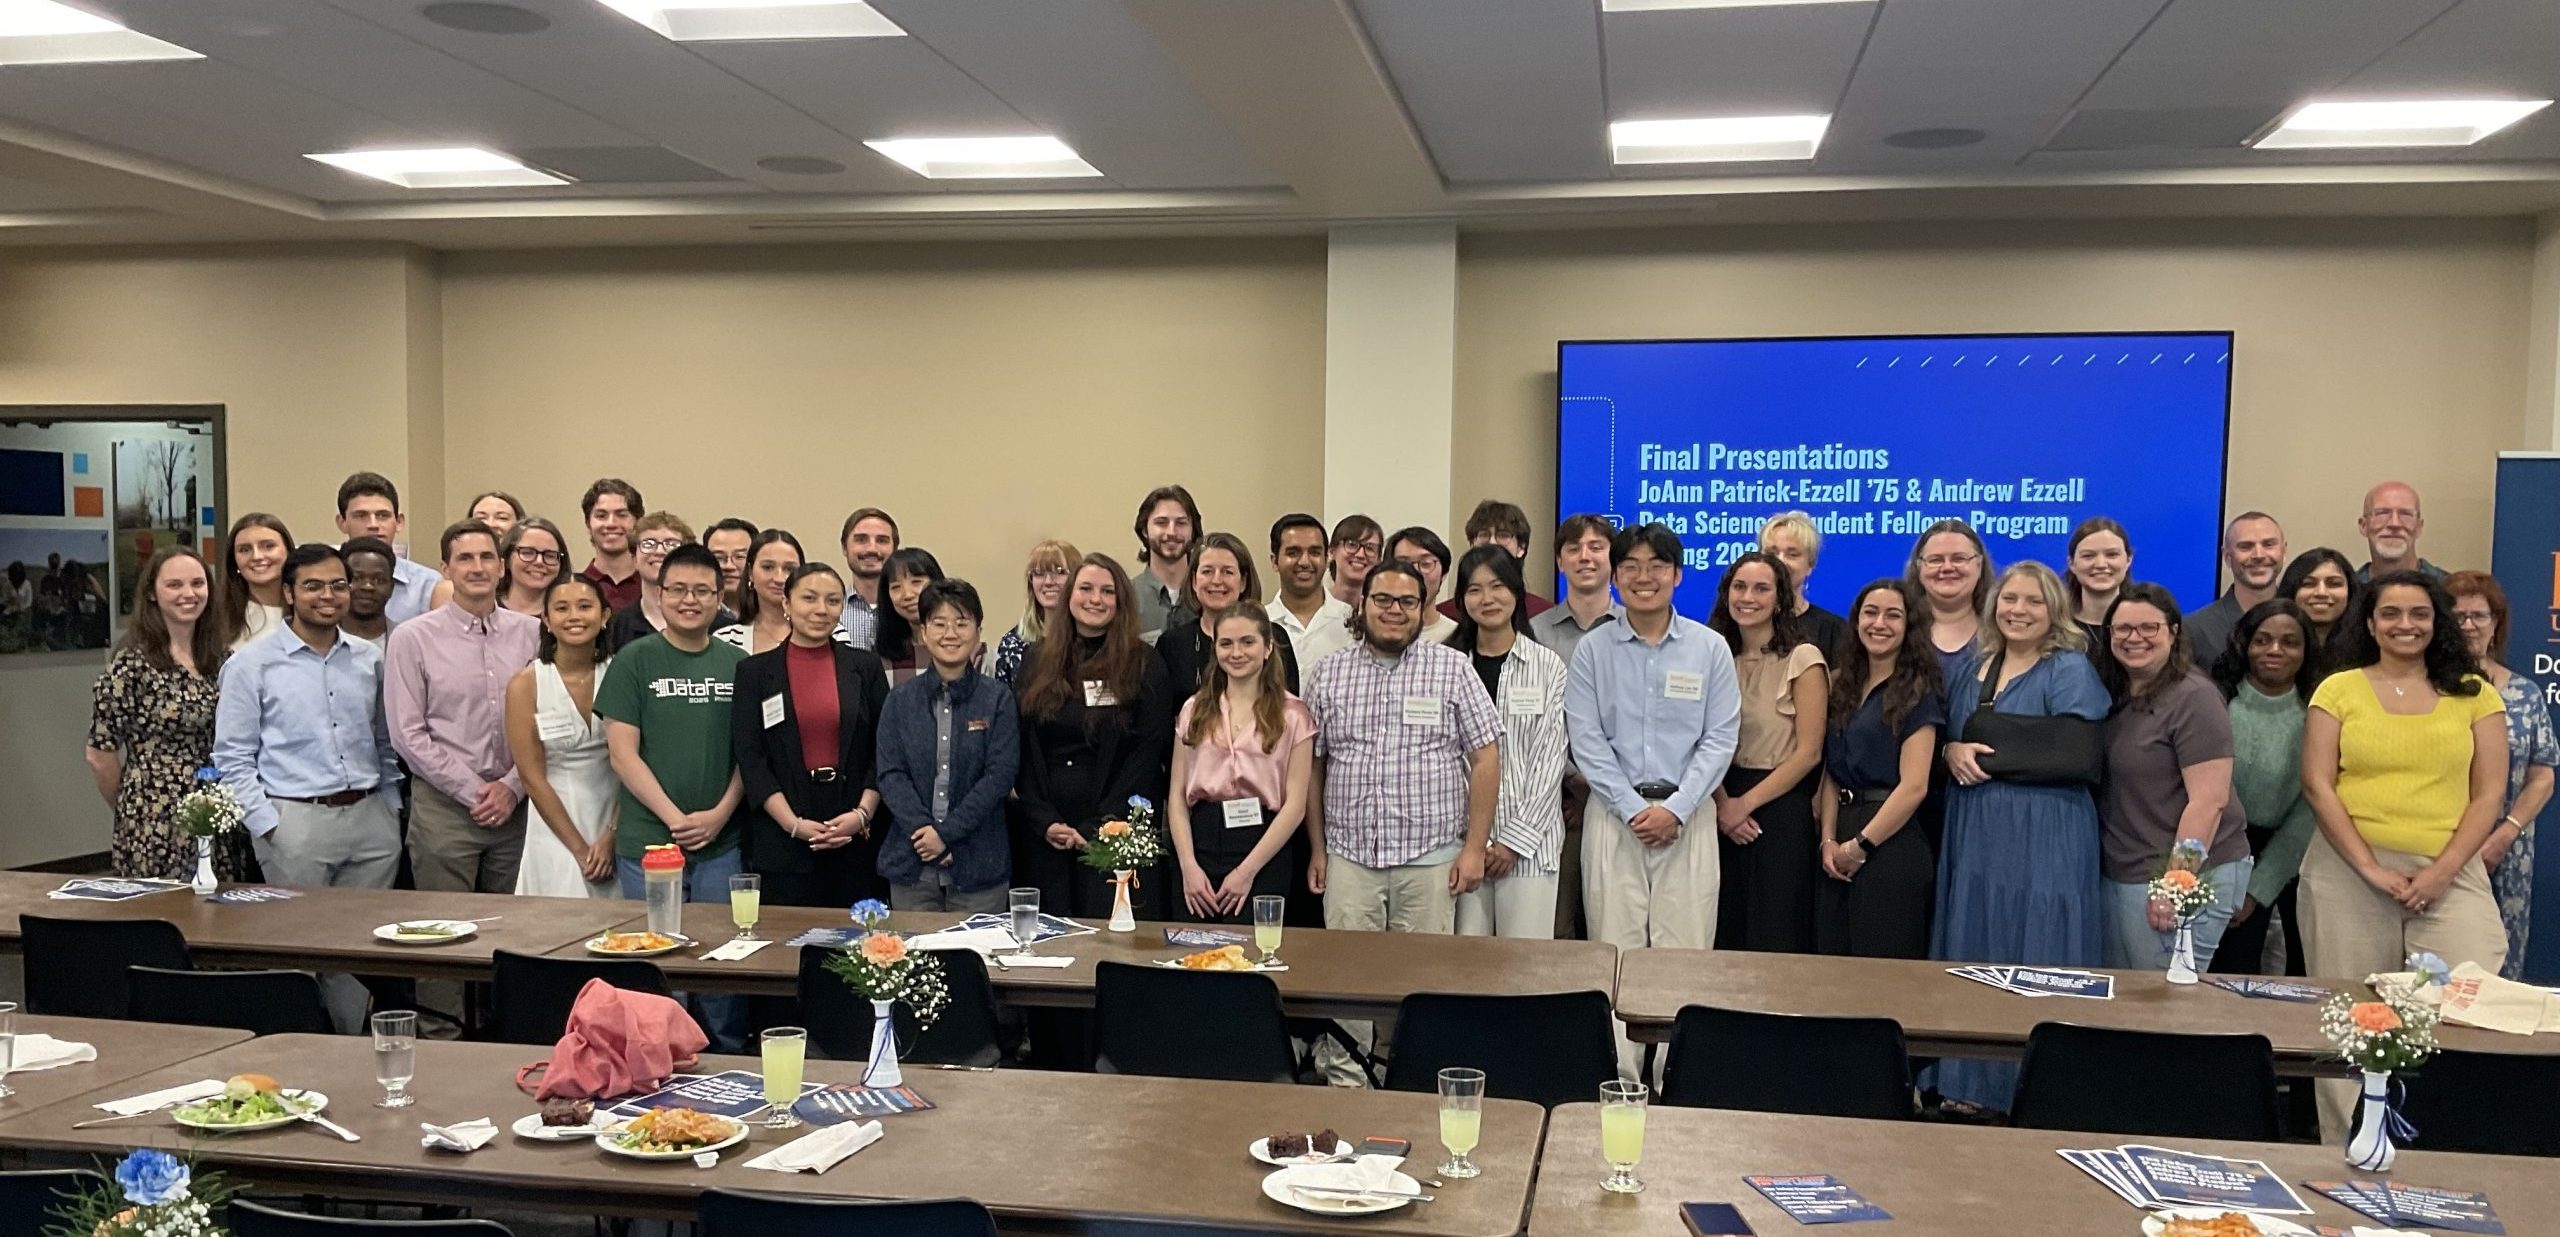
2025 Data Science Student Fellows Final Presentations
Congratulations to all of the JoAnn Patrick-Ezzell ’75 & Andrew Ezzell Data Science Student Fellows! On May 5, 2025, all thirteen teams gathered to give 5-minute presentations about the results of their semester-long projects. See a…
-
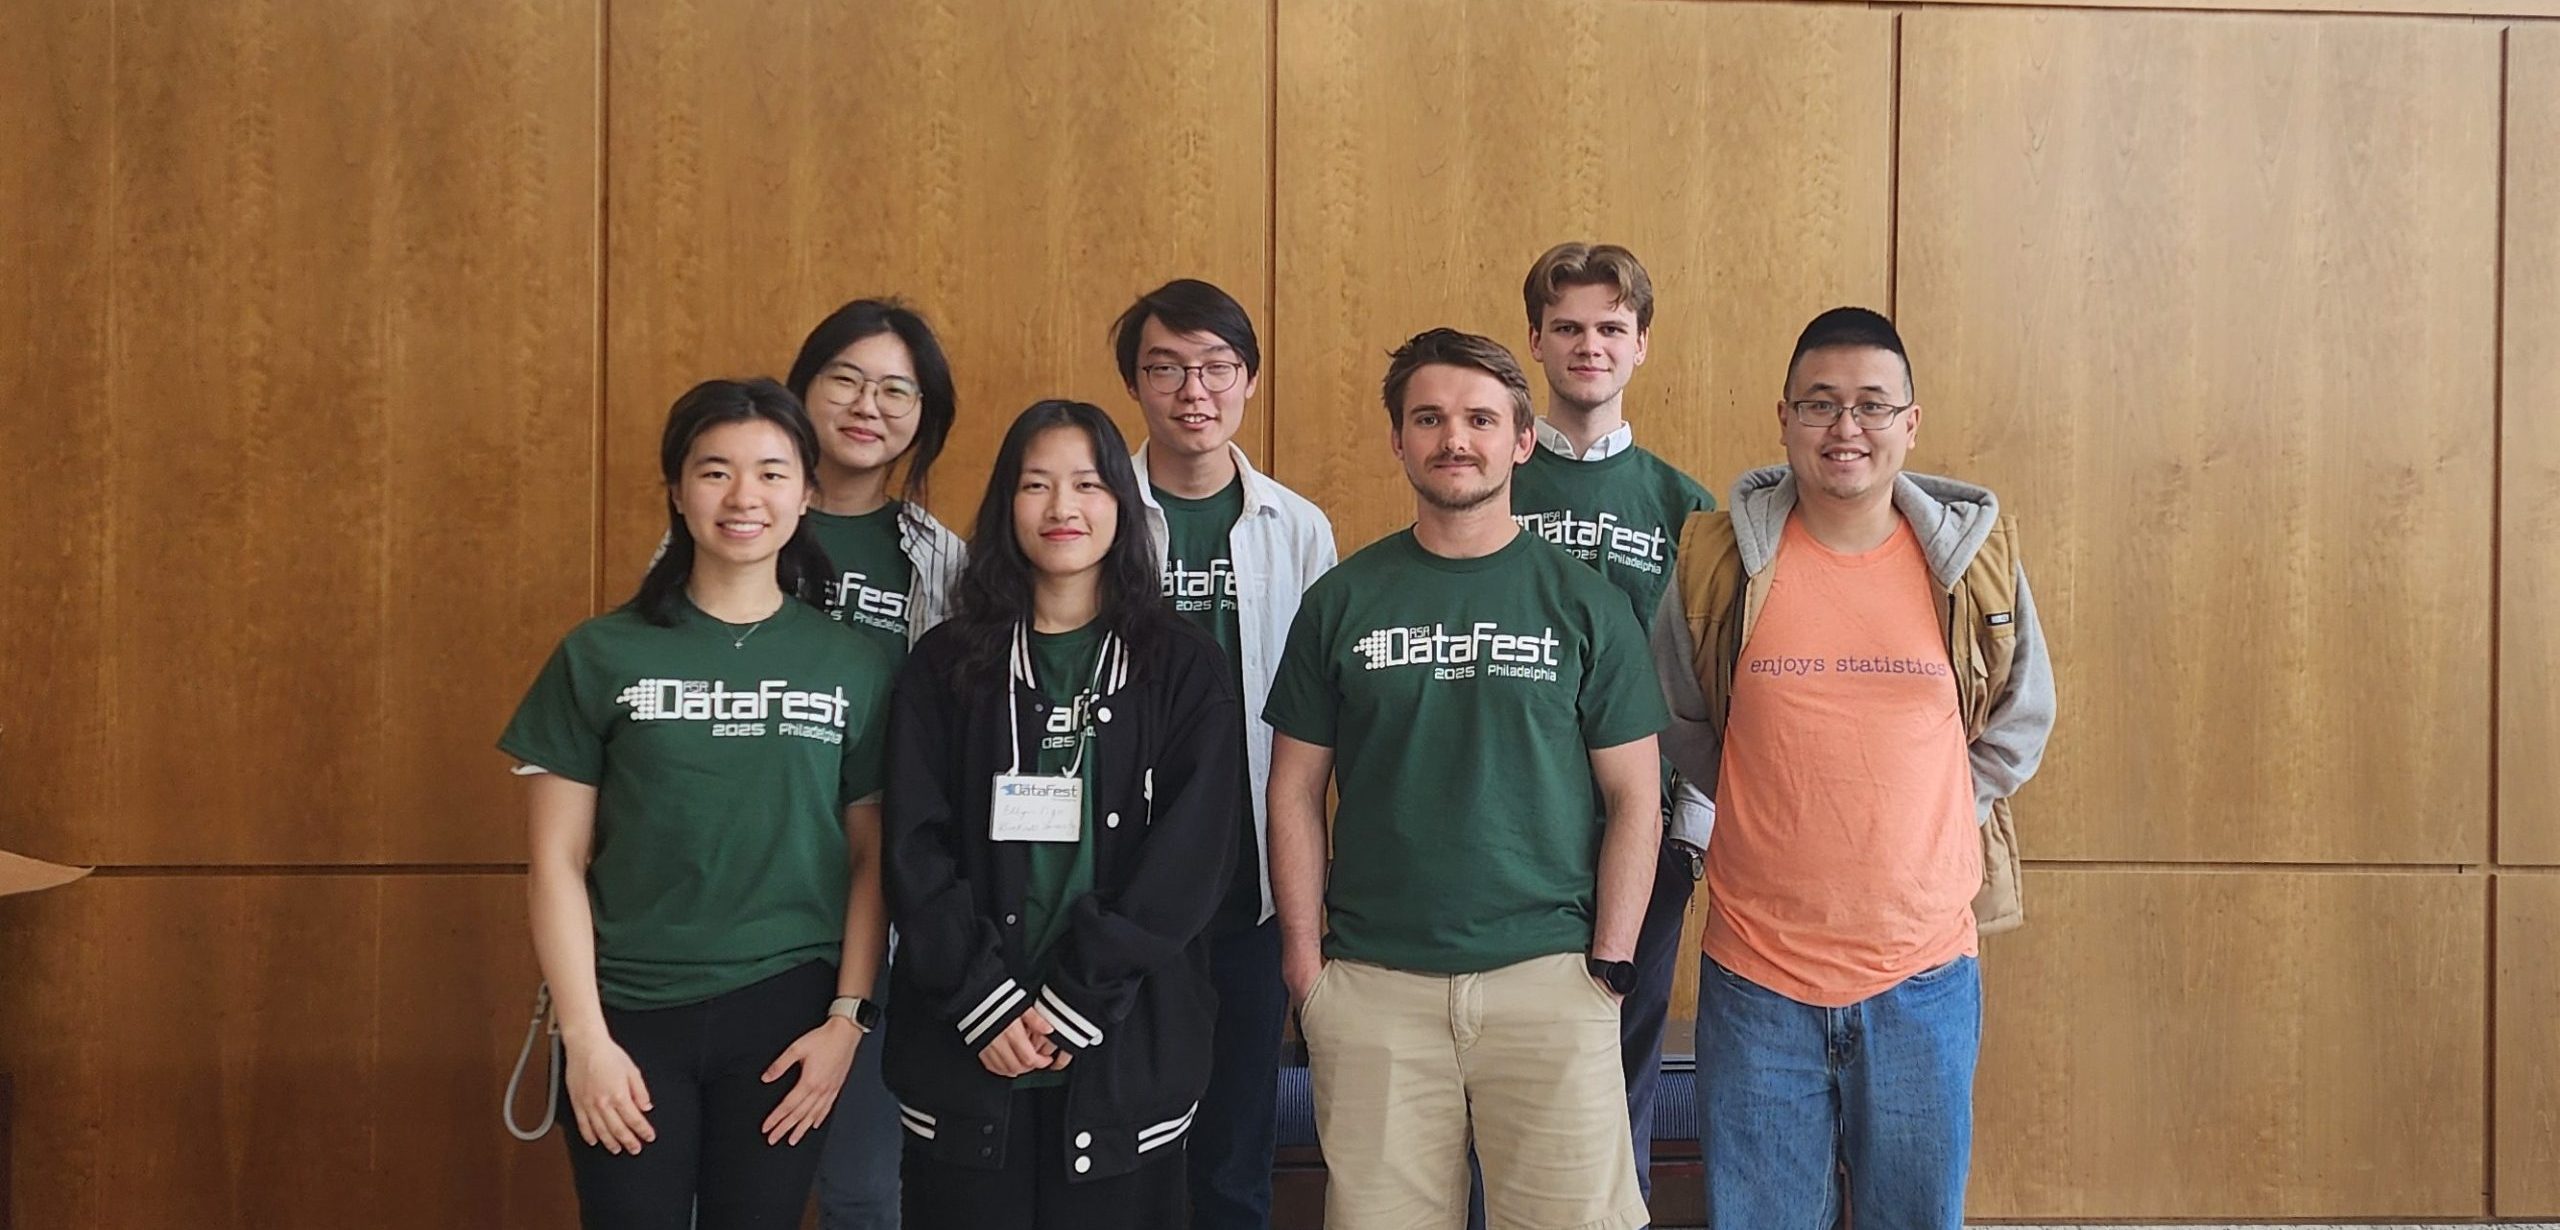
DataFest Philly 2025
Congratulations to the Bucknell students who participated in DataFest Philly 2025! Back row (left to right): Sophie Yang, Dulguun Soyol-Erdene, and Sofi Jeffrey.Front row (left to right): Celine Chang, Ellyn Ngo, Alec Sanders, and Keegan Kang.…
-
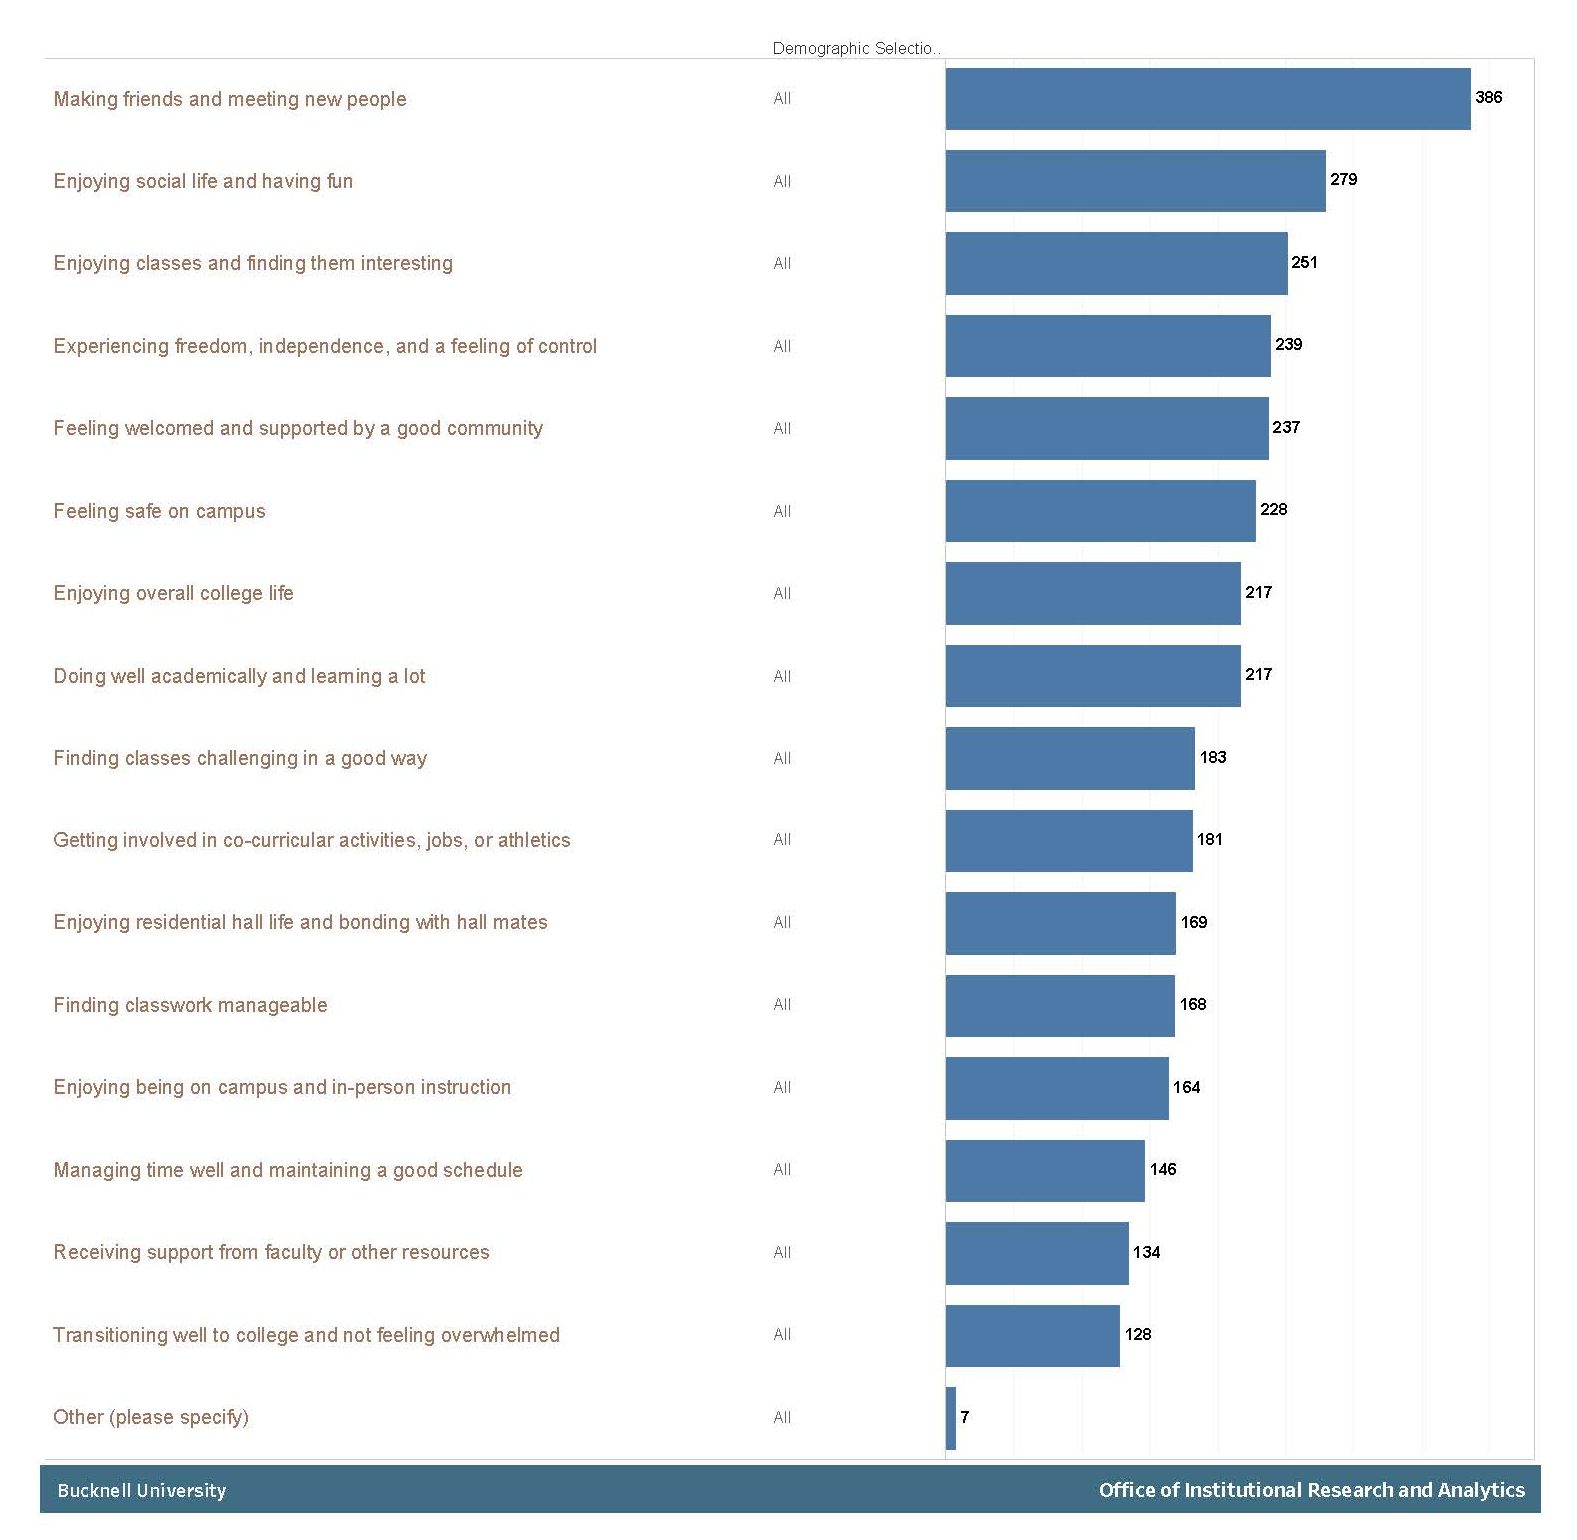
Strategic Data Science Initiatives: Text Analysis Methodology
Researchers: Office of Institutional Research & Analytics (Kevork Horissian, Mike Latorre, Doug LeBlanc, Rita Liu, Sohini Palit, Wei You, and Jocelyn Zhao) We have developed a rigorous, literature-informed methodology for analyzing open-ended survey responses and other…
-
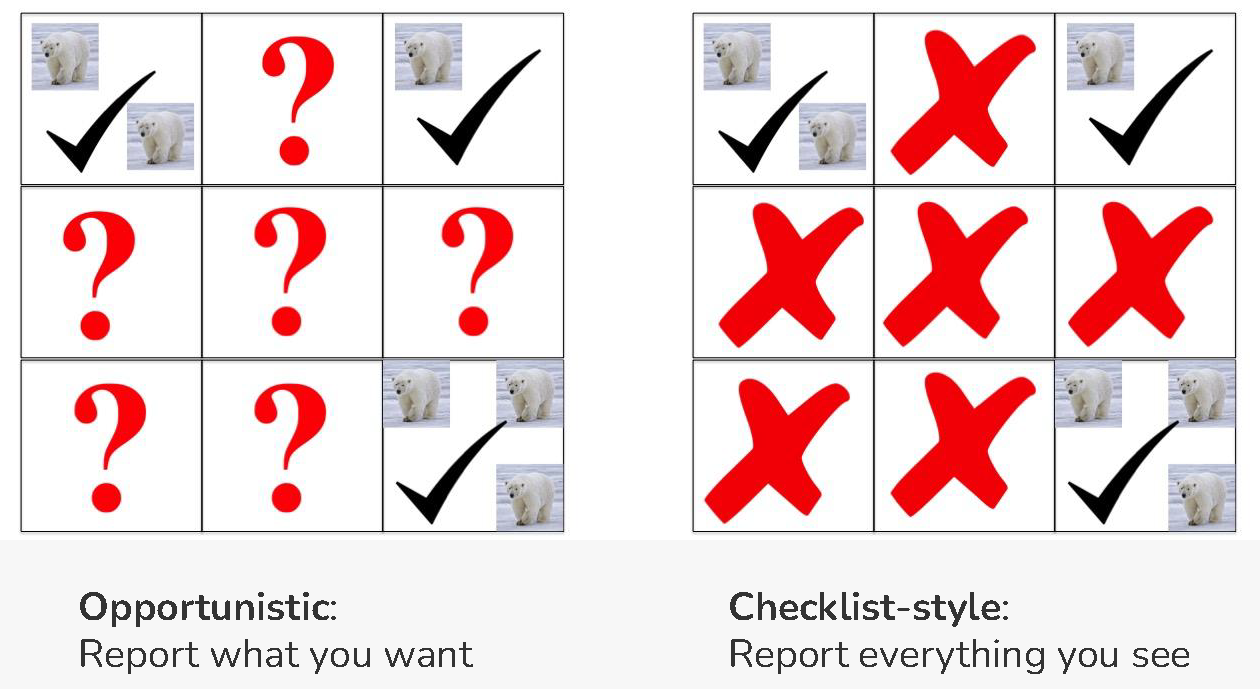
Birds, Butterflies, and Beyond: The Statistical Challenges and Opportunities of Community Scientists as Data Collectors
Researcher: Sara Stoudt (Assistant Professor of Mathematics) Many ecological questions require hard-won data, but thanks to participation from community members on a variety of nature apps like iNaturalist, eBird, and eButterfly, there is more and more…
-
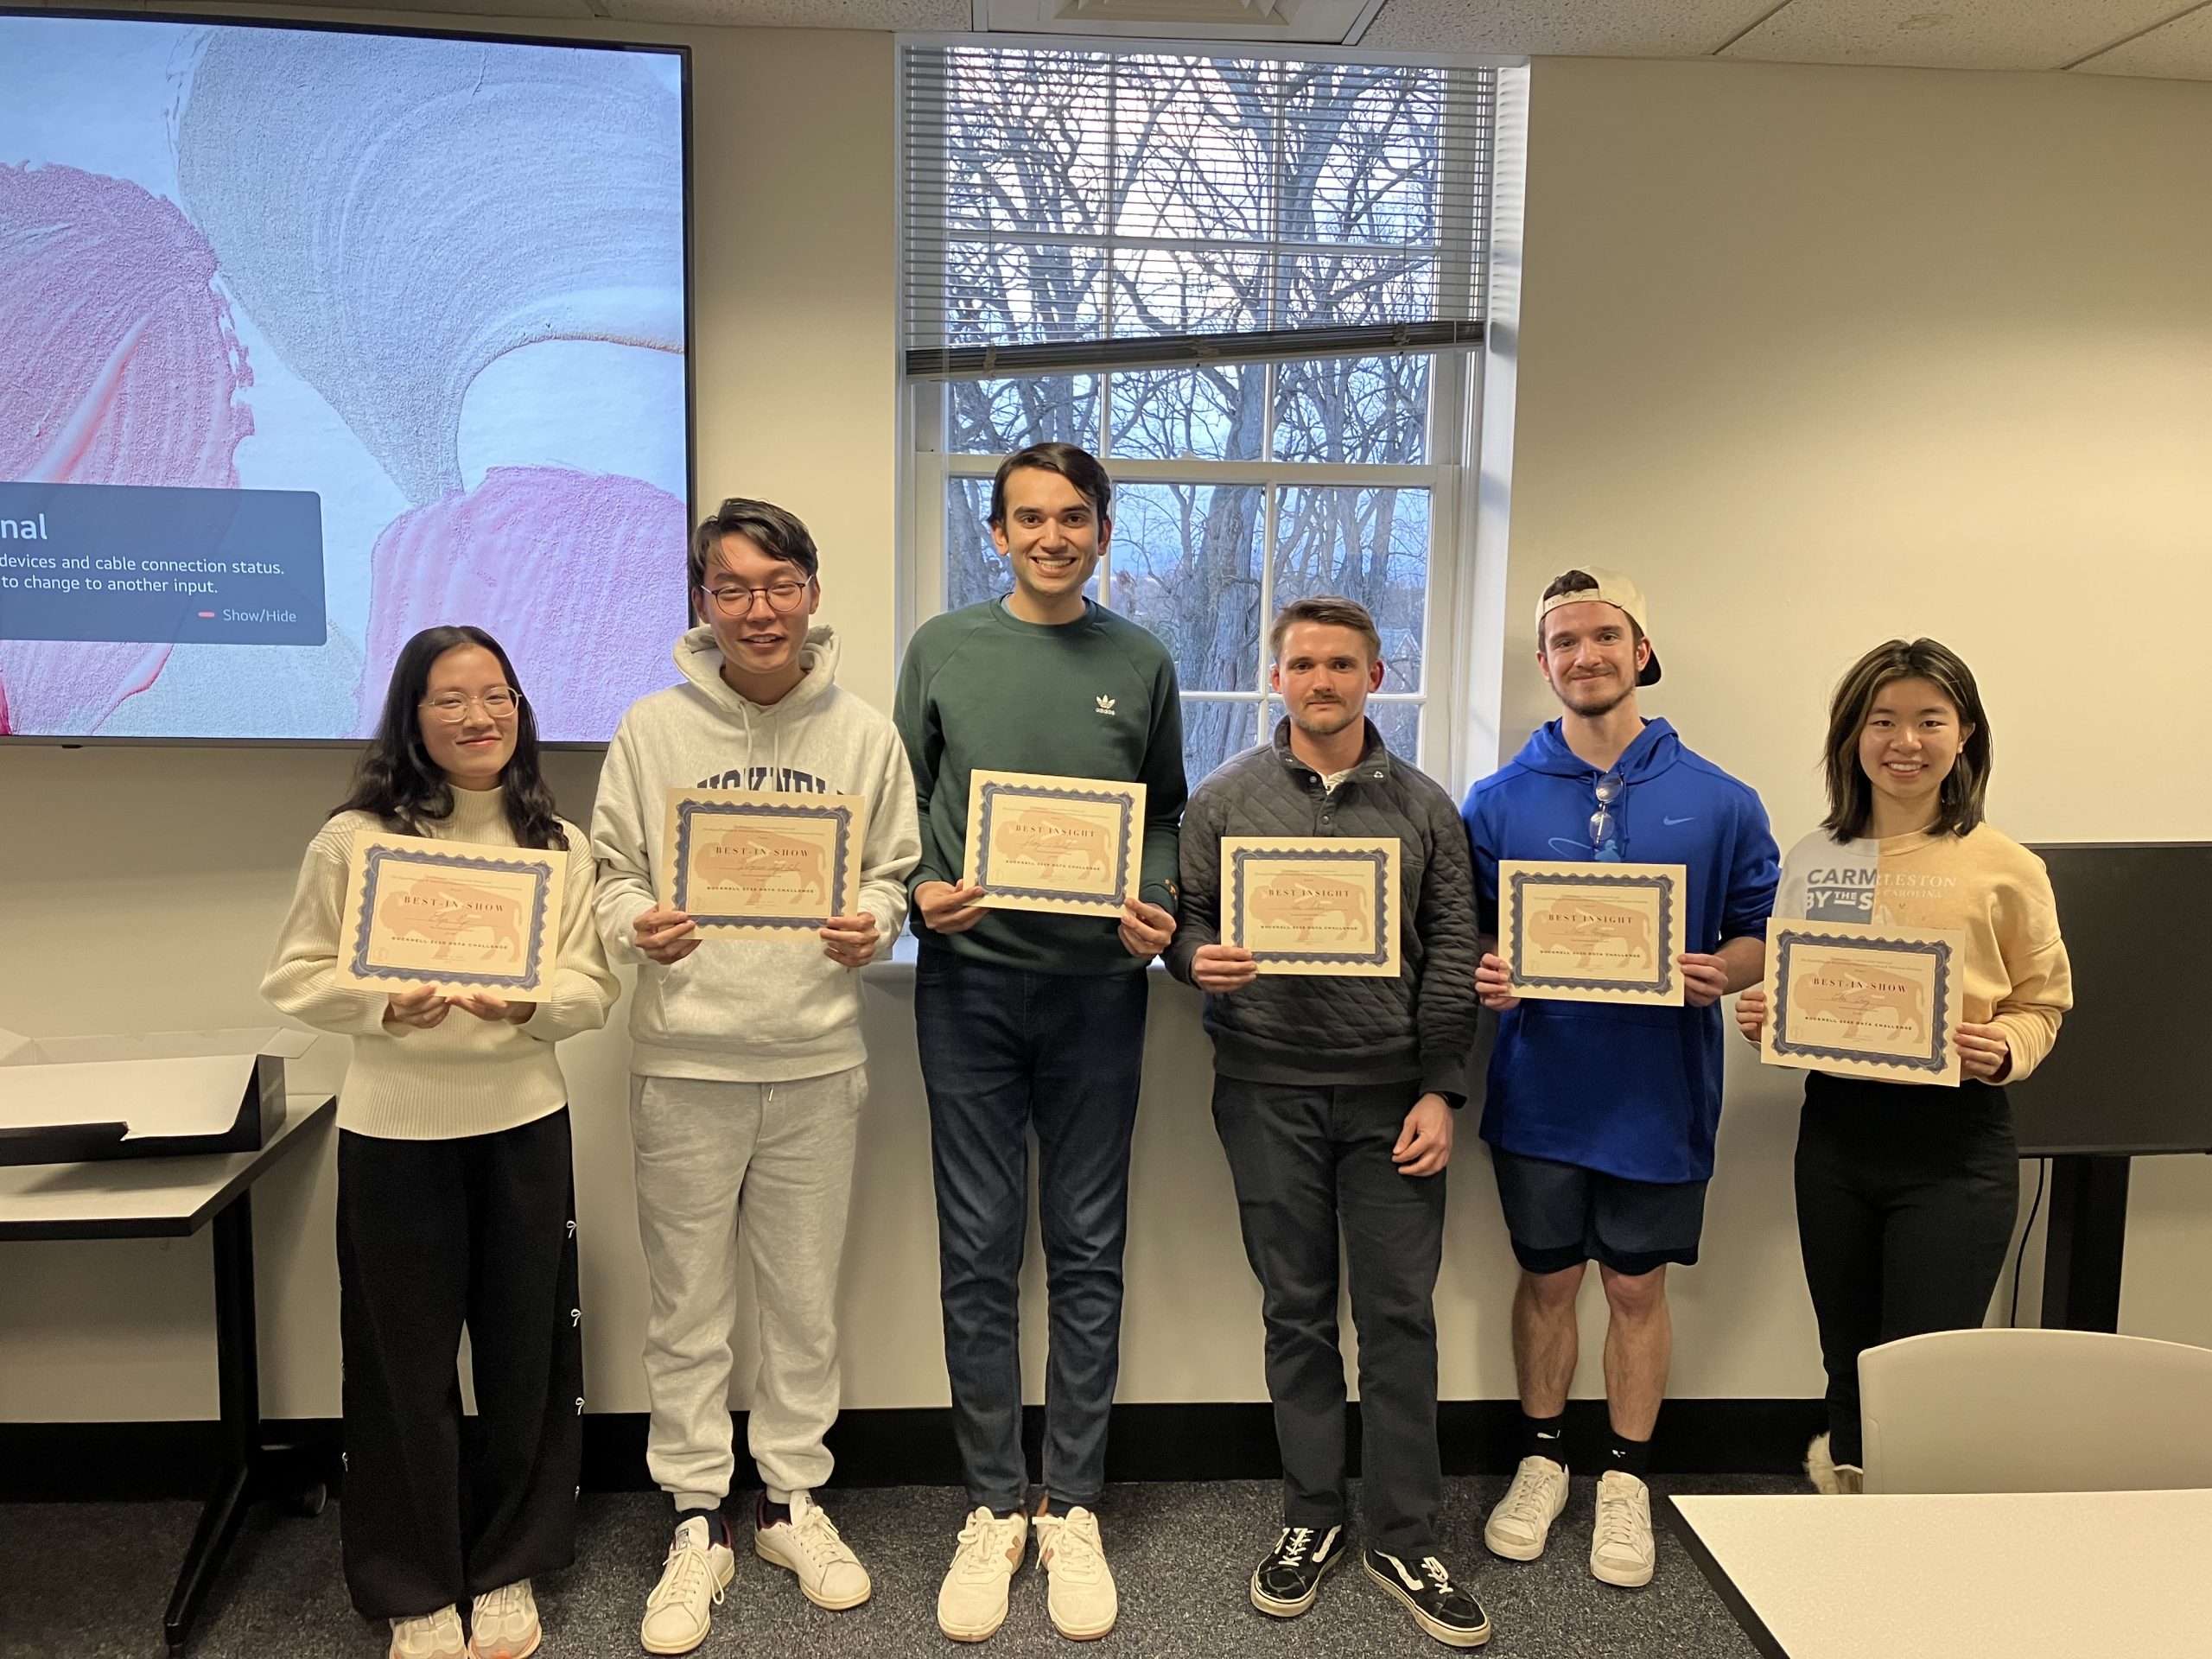
2025 Bucknell Data Challenge Winners
Congratulations to everyone who participated in the 2025 Bucknell Data Challenge!In this week-long data challenge, teams of students were presented with surprise datasets and asked to draw some insight from the data.